The Data Science practice at Alley Interactive encompasses the research, analysis, design, and development of complex data-driven applications. Such applications may require mathematical analysis, real time processing, presentation of data-driven features in extremely high-traffic environments, and the ability for site readers to explore a complex dataset in real time.
We approach Data Science projects from the same business-driven and reader-oriented perspective as we approach all our work. Standalone features such as data centers and interactives kick off with requirements analysis and visual design. Integrative features such as contextual recommendations, comments, and other forms of soft personalization are generally designed in the context of a broader, more holistic digital architecture.
To deliver our projects, we commonly use backend technologies such as Elasticsearch and Redis, often coupled with Node.js, and front-end frameworks such as Angular and React.
Telling Stories with Data
Our Data Science team often builds complex interactive components that help readers better understand a particular topic or news story. For example, during the 2013 rollout of Healthcare.gov, we built a Subsidy Calculator in collaboration with the Henry J. Kaiser Family Foundation to help readers determine their eligibility for insurance subsidies under the Affordable Care Act.
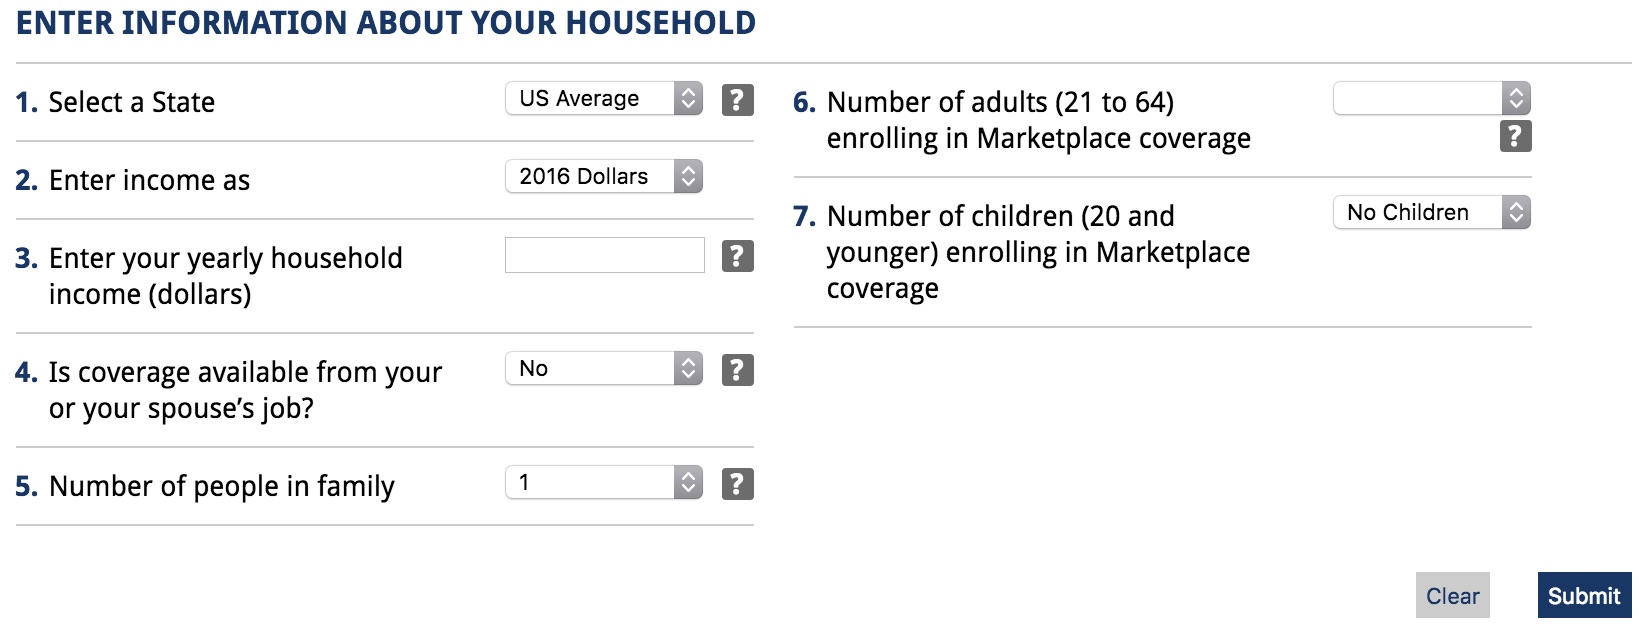
Healthcare.gov, of course, had substantial technology issues at launch, leaving millions of Americans unable to prepare to participate in new insurance plans. This made the Subsidy Calculator immediately indispensible, and during the worst period of their technology crisis, Healthcare.gov actually directed users to KFF.org so they could determine their eligibility. Additionally, dozens of news outlets, including NPR, the New York Times, and CNN, featured an embeddable version of the calculator.
For KFF, we’ve built numerous additional tools to help their audience of policy analysts, government officials, and consumers grasp complex issues of public health policy, including a budget tracker which shows how much the U.S. Federal Government spends on global health, a women’s health feature, and a comprehensive data center that displays public health data across all 50 states, and in some cases, across all of America’s counties and metro areas too.
Driving Reader Engagement
One common requirement our Data Science team tackles is on-site customization according to user traffic patterns to drive recirculation features such as related content. Such features improve time on site and pages-per-visit, but are better generated outside the main CMS using a system like Elasticsearch, which can quickly generate results scored by relevancy.
These soft personalization tactics can become even more effective when coupled with IP-based location detection (geofencing) to activate certain features, ad units, or paywalls.
We often integrate ad servers like DFP, tag management systems, analytics systems like Parse.ly, and page optimization systems to further improve analytical awareness of user behavior and preferences.